Trellus (formerly Asian Human Services) has served the Chicagoland community for nearly 45 years. Their singular purpose is to ensure every immigrant and refugee across Chicagoland has access to personalized support and services necessary to become healthy, educated, and employed. Trellus serves anyone who needs their help and has expertise in the challenges facing refugees, immigrants, and other underserved communities.
In 2016, Trellus engaged with Provisio Partners to help them implement Salesforce. With 70+ federal, state, county and city grants across 60+ service offerings, they needed a platform to streamline their services and provide a 360-degree view of each individual and family’s needs. Previously, they could only see individuals in isolation, or silos, but now they can see how they are providing care to each family and proactively recommend and coordinate additional services outside of their current offerings for truly comprehensive and multi-determinant system intervention.
Tableau enhances the visualizations Trellus needed to gain deeper insight into their data.
The Salesforce platform allowed Trellus to break down silos and barriers in getting people to collaborate and see more about the families and individuals they support. The partnership remains strong between Trellus and Provisio as Trellus continues to implement products from the Salesforce ecosystem. Now that Trellus has been collecting data on the Salesforce platform for a few years, they wanted a better way to visualize all that information and dive deeper into who and how they were serving. Tableau provides them with the visualizations they aspired for: not just to see what they have already done, but to help them see where they should go next.
Free and Reduced Lunch Data Tracking
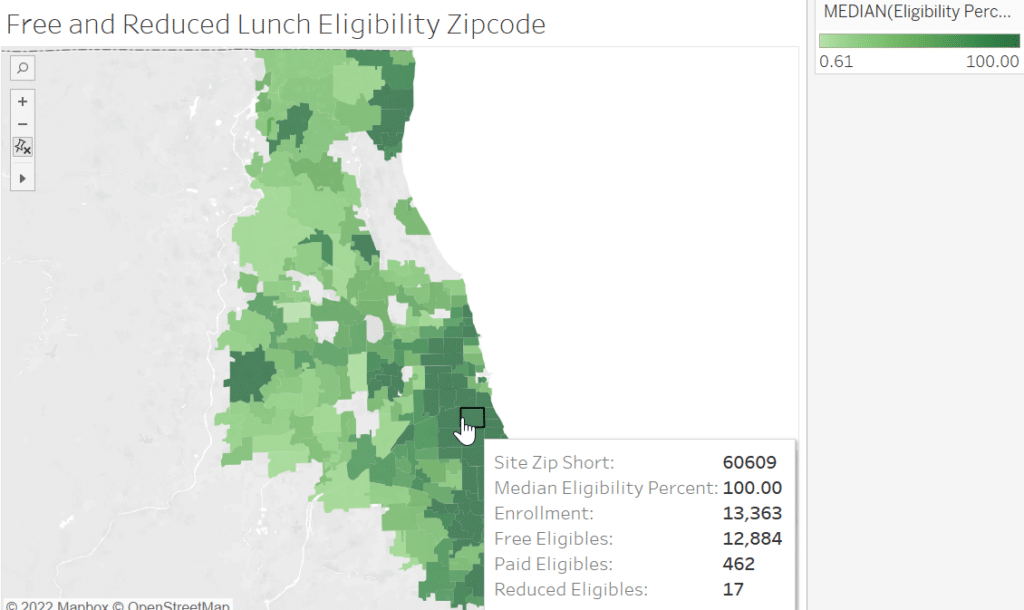
For example, they were able to use the annually released US Census data along with data on free and reduced lunch percentages per Illinois school district to see where children (families) who qualify for free and reduced lunches were located and cross reference that with US Census data showing the race and ethnicity make-up of those same communities. They noticed that many of the children who needed support were moving from the city to the suburbs but culturally and linguistically appropriate services necessary for their well-being were absent from the communities to which they moved. Data plotted on a map helps Trellus see exactly where they need to start reaching out and where they need to advocate to extend funding to help more children and support the communities to which they moved.
Children eligible for Free and Reduced Lunches based upon zip code:

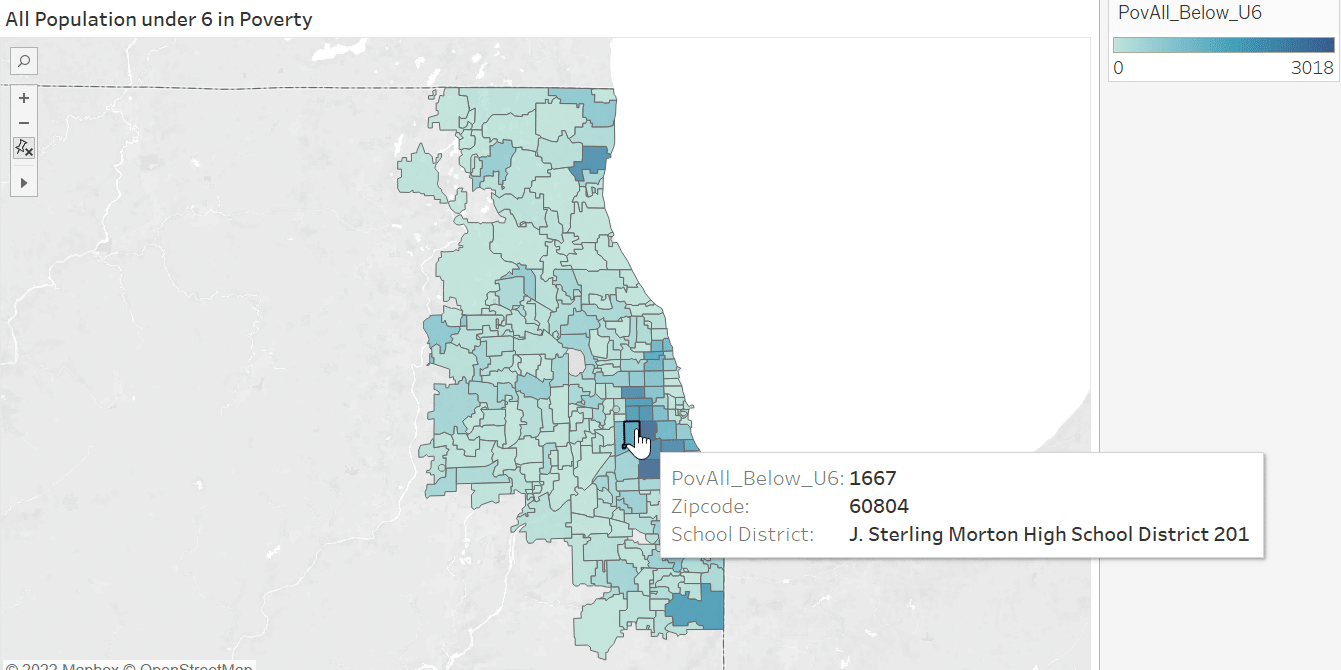
Children Under 6 Living in Poverty:

Trellus has a goal to build and deliver services that make a real difference in the lives of their clients. Their data collection and visualization empowers them to make programmatic changes and extend their services. The ability to share this information with their board and funders allows them to continue to increase their impact, improving lives and strengthening communities.

Marjorie lives in Saint Louis, Missouri. She received her Master’s degree in English from Truman State University. Her responsibilities at Provisio Partners include content creation and technical writing.

